Open data · attributed · live
A data graph of the world’s
apple cultivars
PlantGraph reconciles the public-domain and open-license plant datasets — USDA GRIN, the UK National Fruit Collection, USPTO plant patents, SNP-validated pedigrees, Wikidata, and the historical pomologies — into one attributed graph. Every value traces back to a record in a real source.
Region in focus: Western New York orchards — the first growers using the graph to map what they actually grow.
Heirloom apples
Two centuries of breeding, mapped to the heritage core
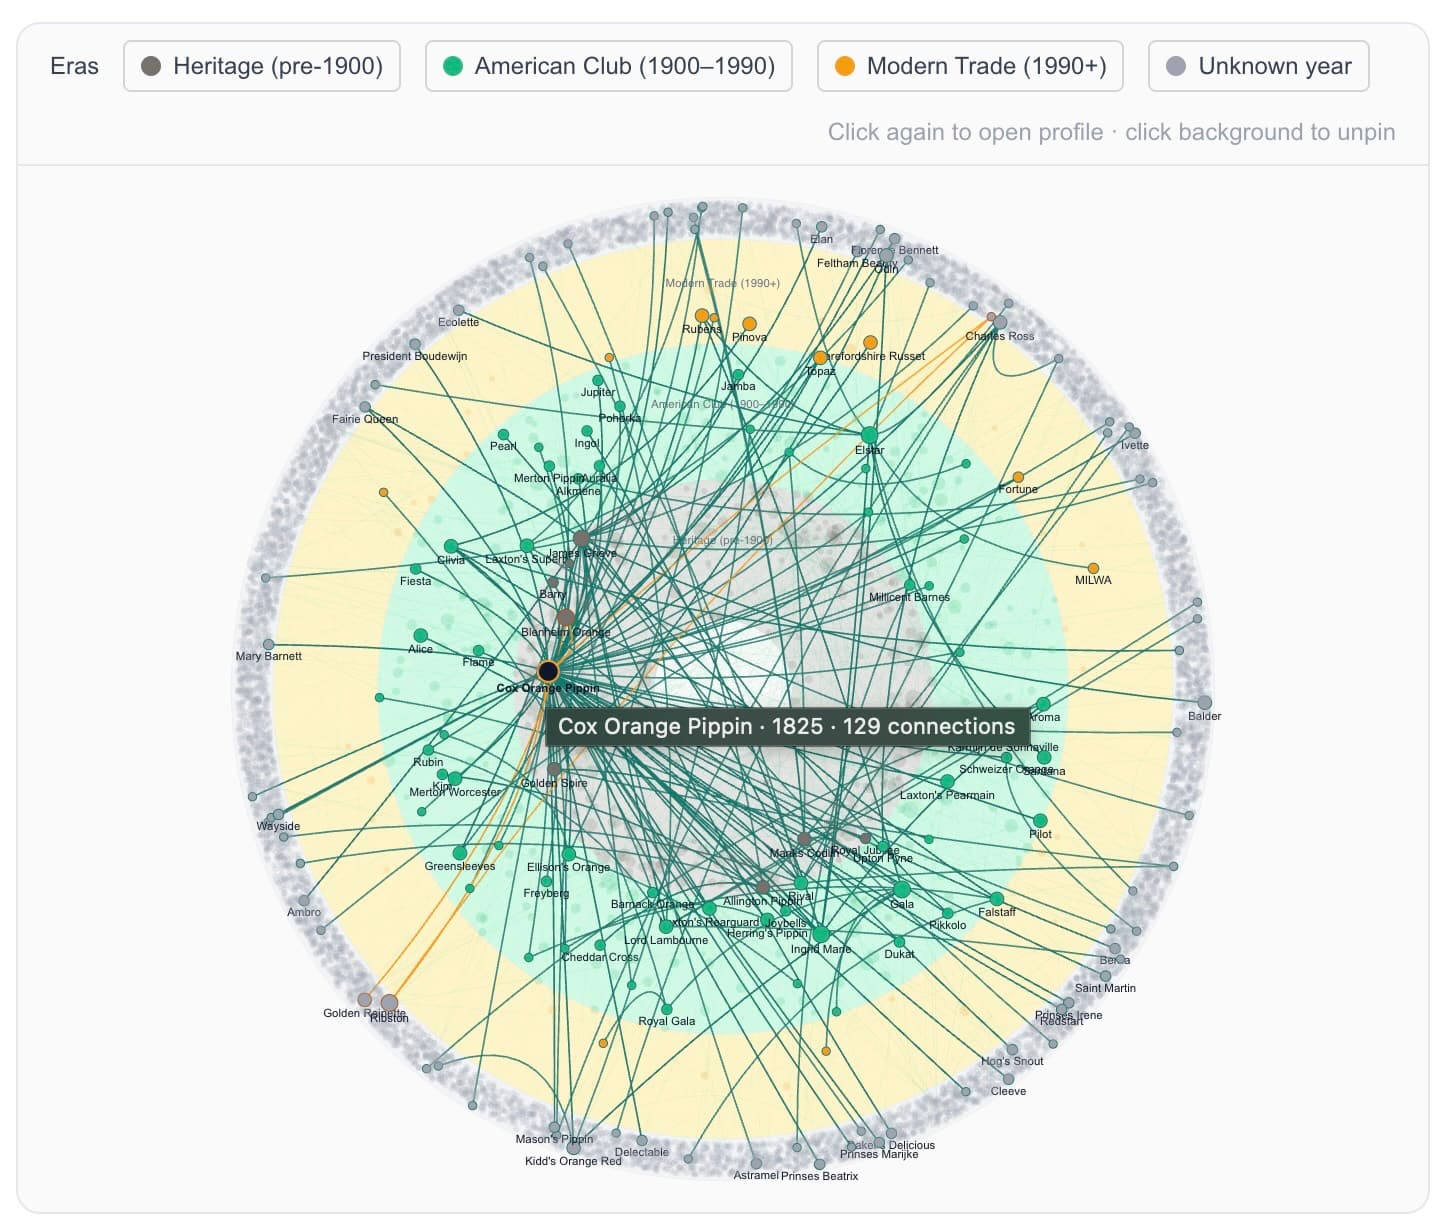
Pre-1900 heirlooms sit at the heart of the modern apple — Cox’s Orange Pippin alone connects to 169 other cultivars across every era since. Each ring below is one breeding generation, banded by era: Heritage (pre-1900), American Club (1900–1990), and Modern Trade (1990–today).
Trace a lineage
Cosmic Crisp and its breeding line, all in one view
Every cultivar in the atlas connects to the parents and progeny that shaped it. Here’s Cosmic Crisp — the amber node — sitting inside its full documented pedigree.